




- Perfality
- October 20, 2026
- 12:07 pm
- Read Time: 10 mintues
Most suppliers think about Home Depot performance in terms of individual orders. Home Depot thinks in terms of fiscal months and quarters, and its performance reports arrive on a schedule that has little to do with when your problems actually happened. A missed shipment in week one can reach you as a deduction weeks later.
That timing gap is why Home Depot fill rate and on-time delivery are best managed as a calendar, not as a series of one-off fixes. This playbook walks through the year quarter by quarter, with what to plan, what to watch and what to repair at each stage.
What Home Depot Fill Rate and On-Time Targets Mean
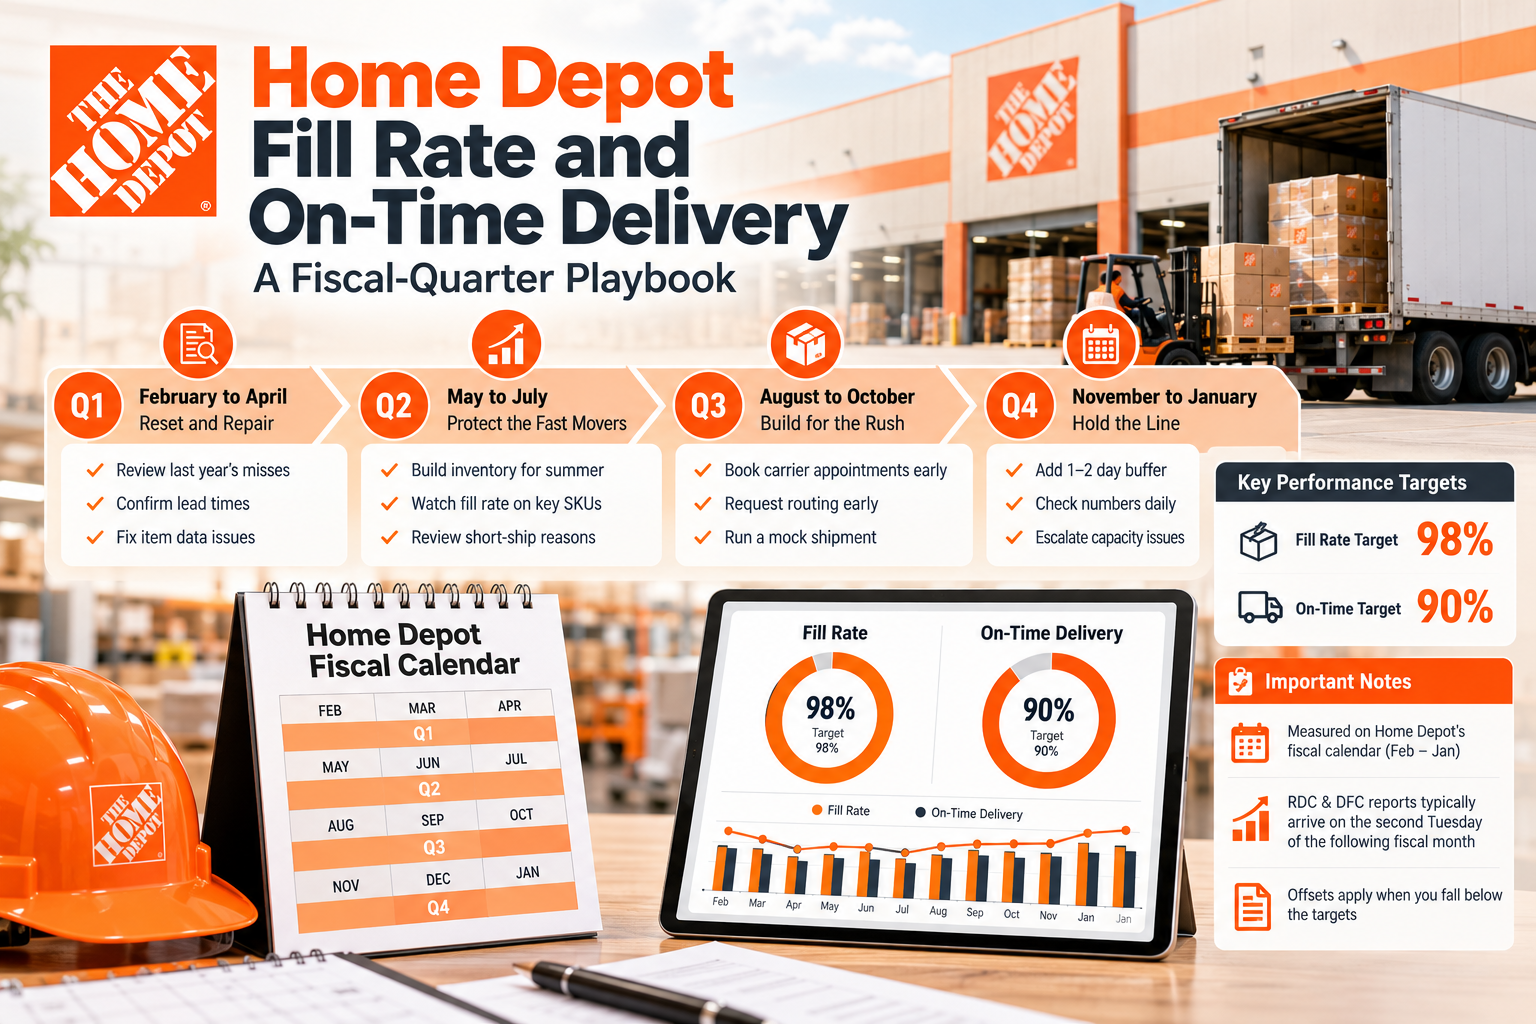
The SPS Commerce guide to Home Depot compliance cites a 98% fill rate target and a 90% on-time target for the RDC and DFC programs, with offsets tied to the share of items affected. Confirm the current figures in your supplier portal, because programs and thresholds change.
Fill rate measures how much of an order you actually ship. If you are measured on 10,000 units in a period, a 98% target allows no more than 200 units to be short. That sounds forgiving until one large order ships half empty.
On-time measures whether the shipment arrives by its must-arrive-by date. Prepaid shipments count as on time if they are received on or before the expected date. For collect shipments, the guide says to mark them ready to ship in the transportation system by 11:00 AM local time two days before pickup.
The Fiscal Calendar at a Glance
|
Fiscal quarter |
Months |
Planning focus |
|
Q1 |
February to April |
Reset the year. Review last year’s misses, confirm lead times and refresh item data. |
|
Q2 |
May to July |
Build inventory for the summer and outdoor season. Watch fill rate on fast sellers. |
|
Q3 |
August to October |
Prepare for the fall push and holiday build. Check carrier capacity and appointment lead times. |
|
Q4 |
November to January |
Protect on-time performance during the busiest weeks. Keep buffers in the schedule. |
Quarter-by-Quarter Playbook
Q1 (February to April): Reset and Repair
- Pull last year’s misses and group them by cause, such as inventory, carrier or paperwork.
- Check that lead times in your systems match what your warehouse can really do.
- Fix item data problems now, before volume rises.
Q2 (May to July): Protect the Fast Movers
- Rank SKUs by velocity and set a higher safety stock for the top fifth.
- Review short-ship reasons weekly and decide whether the cause is supply, planning or data.
- Confirm your reporting rhythm. The guide says RDC and DFC reports appear on the second Tuesday of the following fiscal month.
Q3 (August to October): Build for the Rush
- Book carrier appointments earlier than feels necessary.
- Request routing as soon as an order is ready, and make sure the ready date is accurate.
- Run a mock shipment through the full paperwork cycle.
Q4 (November to January): Hold the Line
- Add a one- to two-day buffer to ship dates, since a late arrival counts however the delay occurred.
- Check the numbers daily rather than weekly.
- Escalate any capacity problem immediately, while there is still time to act.
Early-Warning Signals Worth Watching
- Fill rate on a SKU dropping two weeks in a row.
- Orders marked ready to ship later than your normal cutoff.
- Rising numbers of purchase orders that need partial shipments.
- Carrier appointments being rescheduled more than usual.
Short-Ship Triage: Supply, Planning or Data?
When a purchase order ships short, the cause is usually one of three things, and each has a different fix.
|
Cause |
How to recognize it |
Fix |
|
Supply |
Inventory was not available when the order was released. |
Adjust forecasts and safety stock for the item. |
|
Planning |
Stock existed, but it was committed to another channel or order. |
Set clear allocation rules across channels. |
|
Data |
Pack sizes or case quantities in the system did not match reality. |
Correct the item record and recheck the packaging levels. |
A Worked Fill-Rate Example
Suppose you are measured on 200 purchase orders in a period and need 98% of items to arrive complete. That allows only a few orders to ship incomplete. If one large order with a data error ships 60% filled, that single order can use most of your margin for the whole quarter. Fixing the data issue first protects every future order.
Seeing the same issue early depends on good visibility. Our Perfality Intelligence System is built to give brands that kind of day-to-day view across stock and pricing.
A daily check is the most effective habit. Our guide to a daily SKU health check describes the routine, and our overview of Power BI dashboards explains how teams keep the numbers in front of everyone.
How Perfality Keeps Fill Rate and On-Time on Track
We replace the monthly surprise with a steady, visible rhythm:
- Performance baseline: fill rate and on-time measured by SKU and by order, not just in aggregate.
- Calendar planning: a quarter-by-quarter plan tied to Home Depot’s fiscal reporting.
- Early-warning dashboards: daily visibility through the Perfality Intelligence System and our retail data analytics
- Root-cause reviews: each miss traced to supply, planning or paperwork.
- Escalation support: a clear path when a capacity or carrier problem needs a fast answer.
Related Services
If fill rate and on-time numbers only get attention when the monthly report arrives, a calendar-based routine can change that quickly. For the full picture of what we do for suppliers selling to The Home Depot, see our Home Depot account management service. Depending on where this issue keeps recurring, this is the kind of support that typically helps:
- Full-service Amazon management: Full Service Amazon Management, Full Service Amazon Agency, Amazon Full Service Agency, Full Service Amazon Marketing Agency, Best Full-Service Amazon Agency, Best Full Service Amazon Agency
- FBA-focused support: Amazon FBA Management Agency, Amazon FBA Agency, Amazon FBA Marketing Agency, Amazon FBA Management Service
- Listing and content optimization: Amazon Listing Optimization Services, Amazon Listing Optimization Agency, Amazon Listing Optimization Service, Amazon Product Listing Optimization Service, Amazon Product Listing Optimisation Service, Amazon Product Listing Optimisation Service USA
- Product listing services: Amazon Product Listing Service, Amazon Product Listing Service Provider, Best Amazon Product Listing Service Agency
- PPC and advertising management: Amazon PPC Management Service, Amazon PPC Management Service Agency, Best Amazon PPC Management Service, PPC Management Service For Amazon
- Account management: Best Amazon Account Management Services, Amazon Ecommerce Company
If this is a recurring pain point rather than a one-off, it’s usually worth a quick conversation. Book a free 30-minute call with our team and we’ll walk through what’s actually happening on your account.
Frequently Asked Questions
The SPS Commerce compliance guide cites 98% for the RDC and DFC programs. Confirm the current target in your supplier portal.
The SPS guide describes Q1 as February to April, Q2 as May to July, Q3 as August to October and Q4 as November to January.
The guide says they appear on the second Tuesday of the following fiscal month.
Book carriers early, request routing with an accurate ready date, add a one- to two-day buffer and check performance daily.
Have any questions? Let’s connect!