




- Perfality
- October 19, 2026
- 11:00 am
- Read Time: 10 mintues
Perfality Intelligence System scores every retail listing on nine pass/fail content checks, tracks ratings and reviews by SKU, and turns the gaps into per-SKU fixes for the content and product teams. The result is a clear answer to which listings are incomplete, what exactly is missing and which team should fix it.
Perfality Intelligence System is a digital shelf intelligence platform by Perfality that turns retailer listing data into prioritised, SKU-level actions for brands. This post covers the content and reviews side of the platform.
Key takeaways
- PIS gives each listing a content completeness score based on nine pass/fail checks.
- Content Intelligence shows which checks fail and how many pages meet each retailer requirement.
- Ratings & Reviews tracks ratings and review counts by category, retailer and SKU.
- Suggested fixes are written from each SKU’s own numbers, for example “Add 6 more images (currently 1, target 7 or more).”
How does Perfality Intelligence System score listing content?
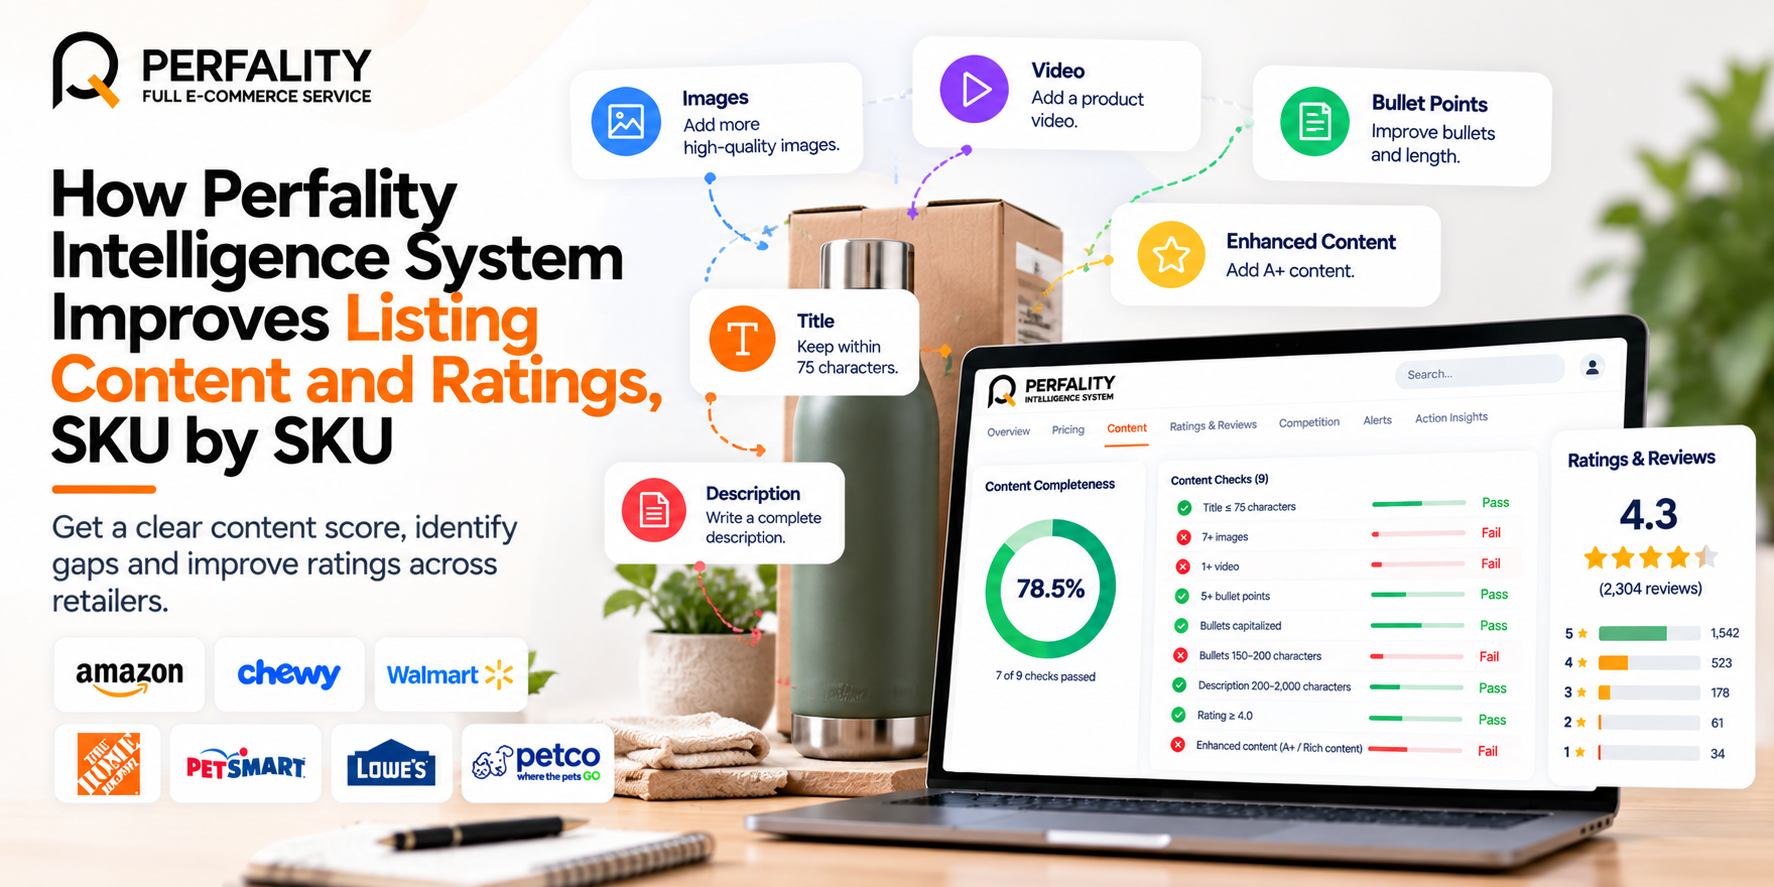
Each listing is checked against nine pass/fail rules, and each check is worth about 11% of the score. Content completeness is the number of checks passed divided by nine. The checks are:
- Title of 75 characters or fewer
- Seven or more images
- One or more videos
- Five or more bullet points
- Bullets capitalised
- Bullets of 150 to 200 characters
- Description of 200 to 2,000 characters
- Rating of 4.00 or above
- Enhanced content (A+ or rich content)
These are the thresholds PIS uses to score content. Individual retailers can have their own requirements, which is why PIS also shows coverage against each retailer requirement.
The average score feeds the Content Completeness headline number on the Overview page. Listings whose pages could not be read are shown as a data gap and left out of content and rating scores, so a failed crawl is never treated as bad content.
What does Content Intelligence show?
Content Intelligence has four tabs:
- Summary lists products with issues, grouped by the check they fail.
- Benchmarks shows attribute coverage: what share of tracked pages meet each retailer requirement, with a list of failing SKUs.
- Products gives a product-level content table.
- Brand gives a brand-level content table.
This makes it easy to see which single fix would help the most SKUs at once. If most listings at a retailer fail the same check, one piece of work can lift many pages.
Why does a listing content score matter for brands?
A listing content score matters because shoppers judge a product by its page. A low listing content score points to missing bullets, short descriptions or too few images.
A listing content score also makes progress easy to see. After a fix, the listing content score rises on the next data load, which tells the team that the change worked. Tracking the listing content score by retailer shows where the weakest pages sit.
A simple routine for the listing content score looks like this:
- Sort SKUs by the lowest listing content score on your busiest listings.
- Read which of the nine checks failed for each one.
- Fix the content, then wait for the next data load.
- Compare the new listing content score with the old one.
A rising listing content score is a clear sign that listing work is paying off. Teams that review the listing content score every week also spot new gaps early, such as a SKU that loses an image. The listing content score keeps content work specific.
How does PIS turn content gaps into fixes?
In Action Insights, the Content department gets a row for each listing with a completeness score under 80%, listing every failing check. A separate row appears for listings with no enhanced content.
Each row carries a suggested action written from that SKU’s own numbers, such as adding six more images when a listing has one and the target is seven or more. These actions come from fixed rules applied to real data, not AI guesses.
Priority follows the share of tracked SKUs affected: High above 15%, Medium from 5% to 15% and Low up to 5%. Rows can be filtered, searched and downloaded as Excel or CSV. Read more in Action Insights.
How does PIS track ratings and reviews?
The Ratings & Reviews page has three tabs:
- Summary shows average rating and review count by category and by retailer. Click a row to see its SKUs.
- Products shows a rating and review table for every SKU.
- Review Sentiment Analysis is for clients who supply review data. It shows individual customer reviews with an item-by-item breakdown, a sentiment distribution chart and filters by item, sentiment and date range, with CSV export.
Sentiment is assigned by a simple, transparent rule from the star rating: one or two stars are negative, three is neutral and four or five are positive. It is never guessed from the review text.
In Action Insights, the Product / CX department gets a row for each SKU rated below 4.0, so the team can look into what is driving the rating.
How do product pages help with content and ratings?
Click any SKU in PIS to open its product page. It shows price, rating, review-count and stock-availability trends, its content checks marked pass or fix needed, the buy box holder day by day and a link to the retailer listing.
That gives a content or CX manager the full history of one product in one place, which helps when you need to explain why a particular SKU is on the list.
Which teams benefit from the content and ratings tools?
- Content and PDP teams see which listings fail which checks and exactly what to add.
- Brand and CX teams see rating trends and which products drag the average down.
- E-commerce managers track Content Completeness and Average Rating on the Overview page.
- Agencies get a consistent, per-brand view of listing quality across retailers.
For hands-on listing work, see Perfality’s Amazon product listing service, or read about our images audit project for a real example of listing media being audited SKU by SKU.
What does a typical content review look like?
A content or brand manager opens Content Intelligence at the start of the week and sorts SKUs by score, lowest first. Each low score comes with the checks it failed, so the first job is clear: add the missing bullet points, write the longer description, or upload the extra images.
Next, they check the retailer view. A SKU may be complete on one retailer and thin on another, so the same product can need different fixes in different places. The team downloads the list, assigns each row and re-checks the score after the next data load, when the latest daily snapshot shows whether the change landed.
Ratings follow the same rhythm. A SKU whose average rating drops triggers a rating alert in the bell, and the Reviews view shows the star breakdown so the team can tell a small dip from a real quality problem.
What are the limits of the content and review tools?
- The nine checks are PIS scoring rules, not official retailer rules.
- Review sentiment follows the star rating, and review data is a client-supplied sample, not necessarily every review.
- PIS shows what to fix. Your team makes the change.
- It helps teams prioritise faster. It does not guarantee more sales.
To see the whole platform, read the Perfality Intelligence System overview, or learn about protecting sales with PIS from stock-outs and lost buy boxes.
How does the listing content score support Amazon listing work?
A listing content score tells a brand which pages are thin and why. A brand with an Amazon FBA management agency, an Amazon FBA agency or an Amazon FBA marketing agency can send the failed checks straight to that team. That removes the guesswork from the first call.
Perfality’s Amazon product listing service covers writing, bullets and images. Brands that look for an Amazon product listing service provider or the best Amazon product listing service agency can use the score to set the brief. It also helps when comparing an Amazon product listing service across providers.
The score is a natural starting point for Amazon listing optimization services. An Amazon listing optimization agency, an Amazon listing optimization service or an Amazon product listing optimization service can work from the failed checks, SKU by SKU. Searches for an Amazon product listing optimisation service and an Amazon product listing optimisation service USA describe the same need.
Perfality works as a full service Amazon agency, so content fixes can sit next to ads and account work. Full service Amazon management, an Amazon FBA management service or an Amazon full service agency can all use the same list. A full service Amazon marketing agency also benefits, because stronger pages convert more of the traffic ads bring in.
Brands comparing the best Amazon account management services, the best full-service Amazon agency or the best full service Amazon agency can ask each one how it finds weak listings. An Amazon ecommerce company with hundreds of SKUs needs a score, not a hunch.
Better pages also help ad spend go further. An Amazon PPC management service, an Amazon PPC management service agency or the best Amazon PPC management service will see less waste when listings are complete. That holds for any PPC management service for Amazon.
Frequently Asked Questions
It is the number of the nine content checks a listing passes, divided by nine. Each check is worth about 11% of the score.
It is shown as a data gap and left out of content and rating scores. Action Insights also flags it for the Data / Ops department so it can be re-crawled.
No. They are the thresholds Perfality Intelligence System uses to score content. Retailers have their own requirements, which the Benchmarks tab reports coverage against.
From the star rating: one or two stars are negative, three is neutral and four or five are positive. It is not inferred from the text of the review.
Only where a client supplies review exports, and that data is a client-supplied sample rather than necessarily every review.
Yes. Each user can connect their own Claude account from Settings, then ask questions. Access is read-only and limited to what that user’s login can see.
The Content department gets rows for incomplete listings, and the Product / CX department gets rows for SKUs rated below 4.0.
Have any questions? Let’s connect!