




- Perfality
- October 27, 2026
- 4:20 pm
- Read Time: 10 mintues
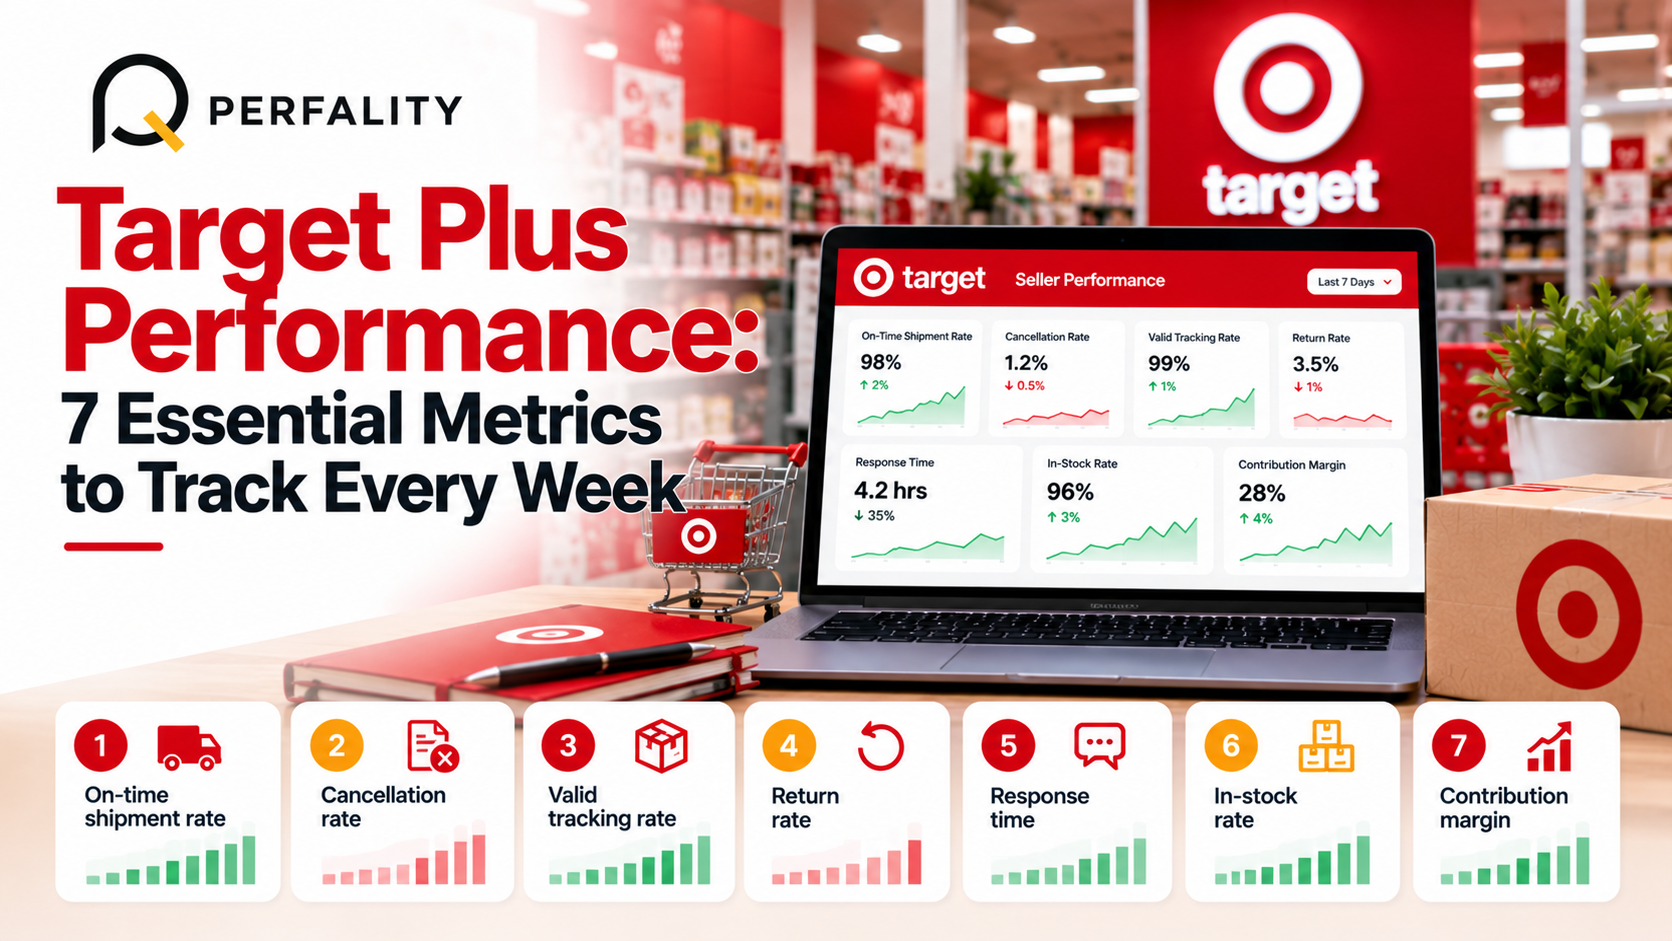
Marketplaces watch sellers closely. Orders that ship late, cancellations and unhappy customers all leave a trail, and that trail shapes how a retailer treats your account. Target Plus performance is therefore not a vague idea. It is a set of numbers, and the brands that track them weekly tend to catch problems while they are still small.
This guide names seven Target Plus metrics worth watching, shows a fictional scorecard with a red-amber-green system and gives a weekly routine that takes under an hour. Target’s official performance standards are shared with approved sellers, so the thresholds below are our own working targets, not Target’s rules. Replace them with the figures in your agreement.
Why Target Plus Performance Needs a Scorecard
Most sellers only look at Target Plus performance after something goes wrong. A customer complains, an email arrives or sales drop, and then the investigation begins. By that point, the problem has often been building for weeks.
A weekly scorecard reverses that order and keeps Target Plus performance visible. You look at a small set of numbers every week, you notice trends early and you act while the fix is still cheap. This habit matters more on a curated marketplace, because a smaller seller pool means each seller’s record stands out.
You do not need a data team. A shared spreadsheet and thirty minutes are enough to start. The aim is consistency, not sophistication.
The 7 Target Plus Metrics to Track
Metric | How to calculate it | Why it matters |
1. On-time shipment rate | Orders shipped on time divided by total orders | Delivery promise is the core of trust |
2. Cancellation rate | Seller-cancelled orders divided by total orders | Usually caused by stock errors |
3. Valid tracking rate | Orders with valid tracking divided by shipped orders | Customers check tracking first |
4. Return rate | Returned units divided by units sold | Shows content and quality problems |
5. Response time | Average time to answer customer messages | Fast replies prevent bad reviews |
6. In-stock rate | Days a product was available divided by days listed | Out-of-stock products lose sales |
7. Contribution margin | Revenue minus all variable costs | Proves the channel makes money |
The first three Target Plus metrics describe delivery. The next two describe the customer experience. The last two describe stock and profit. Together they cover the main ways a seller can succeed or fail on a marketplace.
Delivery metrics: shipment, cancellation and tracking
Third-party guides describe Target as strict about on-time shipping and cancellations. Exact limits are shared with approved sellers, so ask Target for yours. In the meantime, treat any late order as a signal. Late orders usually come from warehouse delays, cutoff times or missed pickups, and each one has a fixable cause.
Customer metrics: returns and response time
Return rate and response time tell you how customers feel. A rising return rate points to a content or quality problem, which our guide on reducing returns explores in depth. A slow response time often explains why mild complaints become bad reviews.
Business metrics: stock and margin
In-stock rate shows whether your inventory plan is working. Contribution margin shows whether the channel is worth it. A store can look healthy on every other measure and still lose money, so never skip the last metric.
A Fictional Weekly Scorecard for Target Plus Performance
Imagine an invented brand, Pinecrest Outdoor, that has tracked Target Plus performance for three months. The team uses a red-amber-green system with its own working thresholds. The table shows one week.
Metric | This week | Working target | Status |
On-time shipment rate | 97% | 98% or higher | Amber |
Cancellation rate | 1.0% | Under 1.5% | Green |
Valid tracking rate | 99% | 99% or higher | Green |
Return rate | 9% | Under 8% | Amber |
Average response time | 6 hours | Under 12 hours | Green |
In-stock rate | 88% | 95% or higher | Red |
Contribution margin | 21% | Above 20% | Green |
The scorecard shows one red and two amber lines. The red line, in-stock rate, is the real problem. Low availability can explain both lost sales and cancellations, so the team starts there. The two ambers get a watch note and a named owner.
All thresholds here are invented for illustration. Set your own from your agreement and your history, then tighten them as the store matures. The point is that every number has an owner, a target and a color that shows at a glance.
How to Read Target Plus Metrics Together
Single Target Plus metrics can mislead. The real insight comes from reading them as a group, because most problems leave a pattern across several measures.
Pattern | Likely cause | First step |
Low in-stock rate and high cancellations | Inventory sync or purchasing problem | Check stock feed and reorder points |
High return rate and slow response time | Content problem made worse by weak service | Fix pages and speed up replies |
Late shipments and weak tracking rate | Warehouse or integration delay | Review cutoff and label upload steps |
Good operations but thin margin | Pricing or cost problem | Rebuild the cost stack |
Train your team to ask what a pattern means, not just whether a number is green. A change in one measure of Target Plus performance is often the first clue to a problem somewhere else, and that habit makes Target Plus performance far easier to protect.
Setting Thresholds for Target Plus Performance
Thresholds turn raw numbers into decisions. Start with the figures in your Target agreement, if they exist. Where Target gives no number, set your own using three inputs: what your history shows, what competitors seem to achieve and what your margin can afford.
Color | Meaning | Action |
Green | At or better than target | Keep monitoring, no action |
Amber | Within a small margin of target, or trending the wrong way | Name an owner and investigate this week |
Red | Clearly outside target | Escalate, contain and fix immediately |
Review thresholds every quarter. As your store matures, targets should tighten. A level that was fine in month one can be too loose in month six, and a scorecard that never changes stops teaching you anything about Target Plus performance.
Reading Trends in Target Plus Metrics Over Four Weeks
One week of data tells you where you are. Several weeks tell you where you are heading. The fictional table below follows Pinecrest Outdoor’s in-stock rate and cancellation rate across four weeks after a supplier delay.
Week | In-stock rate | Cancellation rate | Note |
1 | 96% | 0.8% | Normal |
2 | 91% | 1.1% | Supplier delay begins |
3 | 88% | 1.6% | Cancellations rise as stock runs low |
4 | 95% | 0.9% | Emergency order arrives, safety stock raised |
Look at how the two Target Plus metrics moved together. Cancellations rose a week after stock dropped, and recovered a week after stock returned. A team watching only cancellations would have been surprised. A team watching both could have acted in week two.
This is why lagging indicators, such as cancellations, should always be read next to leading indicators, such as stock. The leading line gives you time to respond.
Who Owns Each Part of Target Plus Performance
Metrics improve when someone owns them. Assign each of the seven measures to a named person, and write the owner next to the number on your scorecard. Shared responsibility sounds fair, but in practice it means nobody acts first.
- Operations lead: on-time shipment, valid tracking and in-stock rate.
- Customer service lead: response time and return handling.
- Content or catalog lead: return rate linked to product pages.
- Finance or channel manager: contribution margin and pricing.
Each owner reports one sentence at the weekly meeting: the number, the cause and the next action. Short reports keep the meeting fast and keep every owner accountable for their part of Target Plus performance.
A 45-Minute Weekly Routine for Target Plus Performance
- Pull the numbers. Export the previous week’s data into your scorecard. Ten minutes.
- Mark the colors. Apply your thresholds to each metric. Five minutes.
- Investigate red and amber lines. Find the cause behind each one. Fifteen minutes.
- Assign actions. Name an owner and a date for every fix. Ten minutes.
- Record the result. Note what you changed so you can see its effect next week. Five minutes.
Hold the meeting about Target Plus performance at the same time every week and keep the format short. A simple, regular rhythm beats an elaborate review that happens once a quarter. Our approach to SKU health checks follows the same logic: scan often, fix small issues quickly.
Building a Dashboard That Tracks Target Plus Metrics Automatically
A spreadsheet is enough at the start of Target Plus performance tracking. As volume grows, manual exports become a chore, and mistakes creep in. At that point, consider an automated dashboard that pulls data from your order system and warehouse.
- Pull data on a schedule, not by hand.
- Show current value, target and trend for each metric.
- Highlight red lines so they stand out at once.
- Allow a drill-down from a metric to the orders behind it.
- Keep a history so you can compare months and seasons.
Our article on Power BI dashboards describes how a live dashboard can replace weekly spreadsheet work, and our retail data analytics service builds these for sellers across channels.
Common Mistakes in Tracking Target Plus Performance
- Tracking too many numbers, so nobody knows which ones matter.
- Using averages that hide a few terrible orders.
- Looking at revenue and ignoring contribution margin.
- Changing definitions between weeks, which breaks comparisons.
- Reviewing numbers without assigning actions.
Keep the scorecard small and the definitions fixed. If you change a formula, note the date and restate earlier weeks so trends stay honest.
What To Do When Target Plus Performance Slips
Even good stores have bad weeks, and Target Plus performance dips happen to everyone. What matters is how quickly you respond. Have a short playbook ready, so the response is calm and organized rather than rushed.
- Confirm the data. Make sure the problem is real and not a reporting glitch.
- Contain the damage. Pause affected listings, expedite pending orders or message customers.
- Find the root cause. Trace it to a step, a product or a partner.
- Fix and document. Apply the fix and write down what happened.
- Talk to Target if needed. If a serious miss could trigger action, contact Target early with your plan.
Documentation matters. A short written record of each incident shows the retailer, and your own team, that you handle problems seriously. It also protects you from repeating the same mistake next quarter.
- Seven Target Plus performance measures defined with formulas
- Working targets set from your Target agreement
- Red-amber-green status for each metric
- One owner per metric
- 45-minute weekly review scheduled
- Incident playbook written
- Dashboard plan ready for when volume grows
How Perfality Supports Your Target Plus Performance
Tracking performance is easy to plan and hard to sustain. For Target Plus performance we typically provide:
- A weekly scorecard with clear owners, thresholds and red-amber-green status.
- Daily monitoring of stock, price and listing errors that cause cancellations.
- Dashboards that bring Target Plus metrics together with your other channels.
- Incident support, including root-cause review and written action plans.
- Ongoing store handling through our Target Plus marketplace management
What you measure each week is what you can improve every month.
Related Services
If you want help to build a scorecard and protect Target Plus performance, our team can help. For the full picture of what we do for sellers and suppliers working with Target, see our Target Plus marketplace management service. Depending on where this issue keeps recurring, this is the kind of support that typically helps:
- Full-service Amazon management: Full Service Amazon Management, Full Service Amazon Agency, Amazon Full Service Agency, Full Service Amazon Marketing Agency, Best Full-Service Amazon Agency, Best Full Service Amazon Agency
- FBA-focused support: Amazon FBA Management Agency, Amazon FBA Agency, Amazon FBA Marketing Agency, Amazon FBA Management Service
- Listing and content optimization: Amazon Listing Optimization Services, Amazon Listing Optimization Agency, Amazon Listing Optimization Service, Amazon Product Listing Optimization Service, Amazon Product Listing Optimisation Service, Amazon Product Listing Optimisation Service USA
- Product listing services: Amazon Product Listing Service, Amazon Product Listing Service Provider, Best Amazon Product Listing Service Agency
- PPC and advertising management: Amazon PPC Management Service, Amazon PPC Management Service Agency, Best Amazon PPC Management Service, PPC Management Service For Amazon
- Account management: Best Amazon Account Management Services, Amazon Ecommerce Company
If this is a recurring pain point rather than a one-off, it’s usually worth a quick conversation. Book a free 30-minute call with our team and we’ll walk through what’s actually happening on your account.
Frequently Asked Questions
Delivery metrics such as on-time shipment, cancellation rate and valid tracking, plus return rate, response time, in-stock rate and contribution margin. Confirm Target’s official requirements with your agreement.
Target shares exact standards with approved sellers. As a working target, many sellers aim for the high nineties, then adjust once they see the figures in their agreement.
Weekly is a good rhythm for most stores. Check stock and orders daily, and use the weekly meeting to review trends and assign fixes.
Have any questions? Let’s connect!